VMware Skyline Health Diagnostics
Overview
During troubleshooting a customer issue, I stumbled accross this a tool which would be very useful helping to understand the causes of system failures while using a VMware ESXi host. The tool is question is VMware Skyline Health Diagnostics. This is a virtual applicance which you can use to analyse Support Logs from an ESXi host in the event of receiving a "Purple Screen of Death" (PSOD) or other instability issues that you may suffer.
In order to get logs to analyse, you can either gather these manually using vCenter/vSphere (more information on that at https://kb.vmware.com/s/article/653)
Now to the main event.
NOTE: For the installation, I will cover VMware Workstation Player, however the steps are broadly the same for VMware vCenter (6.5+).
Requirements
The appliance file which can be downloaded here
NOTE: You will need a free VMWare account to download the .ova file.
Virtual Machine with the following minimum spec:
- 4 vCPUs
- 16 GB RAM
- 250 GB space for storage
- A port group with network connectivity for accessing this virtual machine from your workstation
NOTE: I have given my VM 2 CPUs and 4GB RAM. I have, so far, found that this is more than adequate for what I have used it for thus far. I did not have 250GB free storage in my virtual environment, however the space is thin provisioned by the .ova template so just need to keep an eye on the disk usage!
A virtual environment to deploy the .ova to.
- ESXi host
- VMware Workstation Player - Windows and Linux downloads available and free to install
- QEMU Host - this requires some more work and is not supported by VMWare.
Installation
- Import .ova file to VMware Workstation Player
- You will be asked some configuration questions such as
- root password
- shd_admin password (this is what you will use to log in to the web interface for the fist time
- Network configuration which you can leave blank to obtain DHCP information
- The virtual machine will then being to deploy, this can take around 5 minutes to complete
- Once complete and the virtual machine is booted, open a web browser and either go to https://theIPaddress or https://domainname
- Log in with the shd_admin credentials - Installation is complete
Use
Now that you are logged in to the VMware Skyline Health Diagnostics dashboard, you have a few options.
- Add vCenter/ESXi details - This so that you can connect straight to a VMware host and gather logs directly without having to first gather them from vCenter and then upload them to SHD.
- Upload Log & Analyze - Logs collected manually from vCenter would be imported using this method
- Show Reports - This is to view previously analyzed reports
- Settings - This is where you can check for updates to the tool, add new users and configure other things such as proxy settings.
I did not, at this time, have a VMware host to link this in to and had customer logs to use it with, so I went for option 2, which was a straight forward process.
- Click on 'Upload Log & Analyze'
- Choose a file and click 'Upload & Analyze'
- Allow some time (around 3-5 mins, log size dependant) for the tool to work it's magic
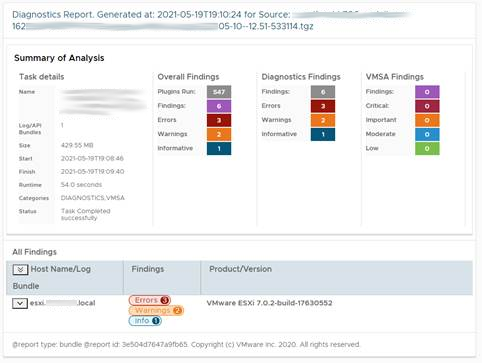
- Once completted, you will see a very high level summary output and you can chose from here to
a. Download output as an HTML file for sharing with others or
b. View the report straight away. - The report will give a more detailed summary of the issues found at the top
- You can then drill down in to this for more detail on the OS (drivers loaded, firmware levels, OS version and such). In the report, links to VMware KB articles for known issues will also be provided.